Investment Manager’s Report: Summary
An extract from the full Investment Manager’s Report
The financial information set out below does not constitute the company's statutory accounts for the years ended 30 April 2022 or 2021 but is derived from those accounts. Statutory accounts for 2021 have been delivered to the registrar of companies, and those for 2022 will be delivered in due course. The auditor has reported on those accounts; their reports were (i) unqualified, (ii) did not include a reference to any matters to which the auditor drew attention by way of emphasis without qualifying their report and (iii) did not contain a statement under section 498 (2) or (3) of the Companies Act 2006.
The full Annual Report and Financial Statements for the Year Ending 30 April 2022 can be found here.
Market Review
An unexpected monetary volte-face by policymakers amid persistently high inflation weighed on equity markets and valuations during the year. However, losses were more than offset by pronounced US Dollar strength which gained more than 12% on a trade-weighted basis and more than 9% against the British Pound (GBP). As a result, the MSCI All Country World index over the year to 30 April 2022 gained 4.3% in sterling terms, aided by a strong first half characterised by economic reopening, upward earnings revisions, and rampant M&A.
The strength of the US Dollar mirrored sharply higher US interest rate expectations following the revelation in November that the Fed no longer believed inflationary pressures were ‘transitory’. Energy prices likely played a part in driving this Fed Pivot as oil and commodity prices rose 79% and 54% respectively during the year. Higher risk-free rates (10-year US Treasury yields increasing from 1.6% to 2.9%) resulted in a much more challenging fiscal second half with negative headline returns failing to capture the magnitude of the correction experienced by the average stock. While the US, as measured by the S&P 500, gained 10.2% in sterling terms (and 0.2% in local terms), drawdowns were significantly greater elsewhere including Europe (Eurostoxx 600 +2.3%), Japan (Nikkei 225 -12.0%) and Asia ex-Japan (MSCI Asia ex-Japan -12.9%) [all in sterling terms]. Weakest performance was reserved for Chinese stocks (MSCI China -29.8%) where a deluge of regulatory changes and market unfriendly developments took their toll on investor sentiment and lockdowns in Shanghai towards period end reflected the challenge posed by the omicron variant to China’s zero- COVID policy.
Small-cap indices meaningfully underperformed during the year, with the Russell 2000 (small cap) declining 9.6% while the Russell 1000 (large-cap) advanced by +6.2% (both in sterling terms). Breadth also continued to deteriorate with just c.25% of NYSE stocks trading above their 200-day average at year-end, compared to 58% a year earlier.
The first half of the year saw markets grind higher amid economic reopening, positive earnings revisions, and record equity inflows. This was possible due to worldwide vaccination programmes that succeeded in breaking the link between COVID-19 infections and deaths. Economic recovery was most evident in consumption trends and in labour market strength, the US unemployment rate falling below 5% by September before returning to pre-COVID levels by year end. The recovery trajectory was complicated by waning fiscal stimulus and labour shortages, exacerbated by the combination of limited improvement in the labour participation rate and early retirement (aka the ‘Great Resignation’). However, the most significant headwind was commodity shortages and soaring energy prices with oil surpassing $80/barrel in November for the first time since 2014, while US producer prices rose 8.3% y/y in August, the largest year-on-year increase on record. The combination of shortages and a surfeit of freshly printed liquidity saw CPI increase 5% y/y in May – the fastest growth in consumer prices since August 2008. This led to the June FOMC ‘dot plot’ implying two rate hikes in 2023, up from zero in March, and, in October, the Fed signalled that it could begin scaling back asset purchases in November. However, equity markets were able to shrug off these negative developments largely due to the Fed maintaining its earlier ‘transitory’ stance and persistently negative real rates supporting equity multiples.
The emergence of the highly mutated Omicron variant in November was an inauspicious start to what proved a very challenging fiscal second half. In the same month, recently re-nominated Fed Chair Jerome Powell performed a remarkable pivot regarding inflation, declaring “it’s probably a good time to retire that word [transitory]”.
While the milder variant of COVID likely contributed to a “more hawkish variant of the Fed”, it was November’s CPI print (+6.5% y/y) – the highest reading since 1982 – that likely forced Powell’s hand. Hawkish monetary developments dominated the balance of the year, with the Fed first moving to double the pace of tapering in December. An inflation shock morphed into a rates shock as the release of FOMC minutes in January raised the spectre of rate hikes and quantitative tightening (QT) “sooner or at a faster pace than participants had earlier anticipated”.
The first US rate hike since 2018 was also delivered in March, three months after the UK became the first G7 economy to raise interest rates since the pandemic began. By the end of April, markets had priced in Fed Funds at 250bps having anticipated zero rate hikes little more than a year earlier, and 10-year US Treasury yields had backed up to 2.9%, almost doubling during the first four months of 2022. The persistence of inflationary pressures saw other central banks adopt more hawkish positions too, forcing rates higher.
Long-duration stocks felt the full force of this monetary about-turn with the earlier tremor in weaker, more speculative names turning into a full risk-off episode across high growth and long duration names. This was particularly true within small caps where growth stocks trailed value by more than 20% during the year.
In addition to the human tragedy associated with the invasion of Ukraine, the conflict added untimely upside pressure to inflation and downside risk to global growth forecasts. Reflecting the elevated risk of so-called ‘policy error’ (the Fed tightening against this most uncertain of backdrops) the two-year versus 10-year Treasury yield spread briefly inverted during March, something often seen as a precursor to a recession.
Ben Rogoff
Partner, Technology
Technology Outlook
Earnings outlook
After increasing 9% in 2021, worldwide IT spending is expected to reach $4.4trn this calendar year representing an increase of 4.0%, in current dollar terms. However, this forecast has already been revised lower from +5% forecast in January reflecting deepening geopolitical and macroeconomic risks. For 2022, the technology sector is expected to deliver revenue and earnings growth of 11.2%/12% while the S&P 500 is forecast to grow at 9.8%/10.3% respectively. These forecasts do not look unreasonable, particularly after a solid Q1 results seasons that at the time of writing has seen the sector deliver 11.7% y/y revenue growth. However, guidance has been more mixed than usual, likely reflecting inflation, supply chain challenges, USD strength and the impact of the conflict in Ukraine. These headwinds come at a tricky time for the technology sector’s net profit margins which are elevated at c.25% as compared to the five-year average of 21.8%. Sustained US Dollar strength could challenge revenue estimates given the sector’s international exposure of 59% (the highest of any sector) vs. 41% for the market.
Valuation
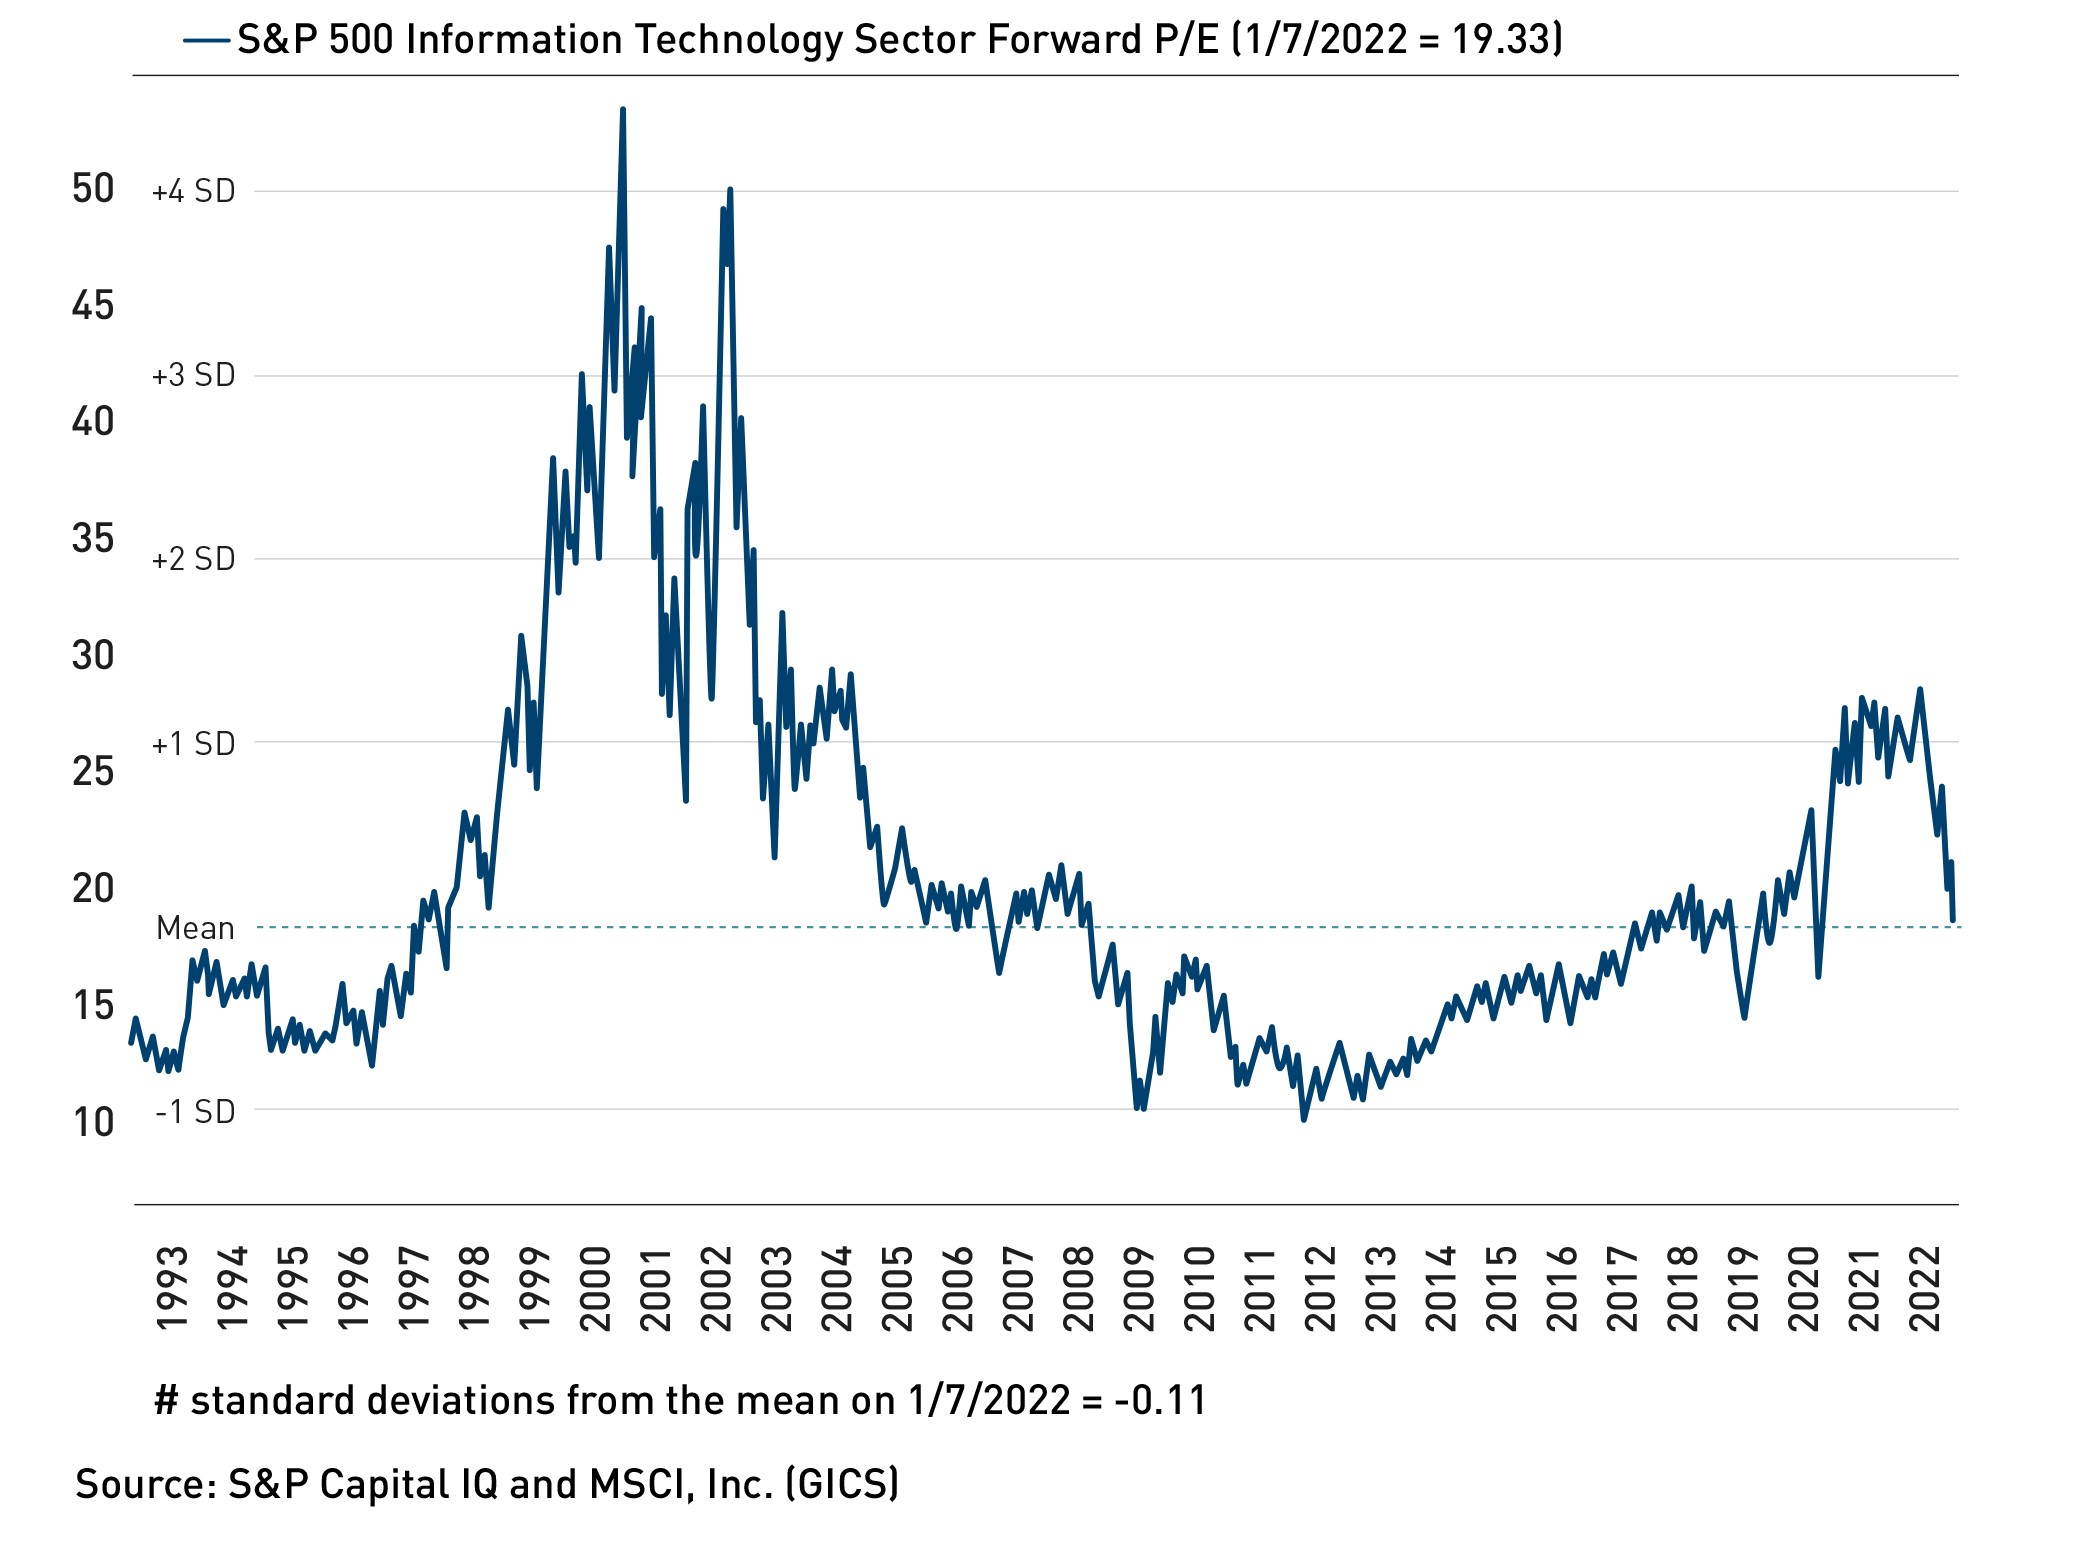
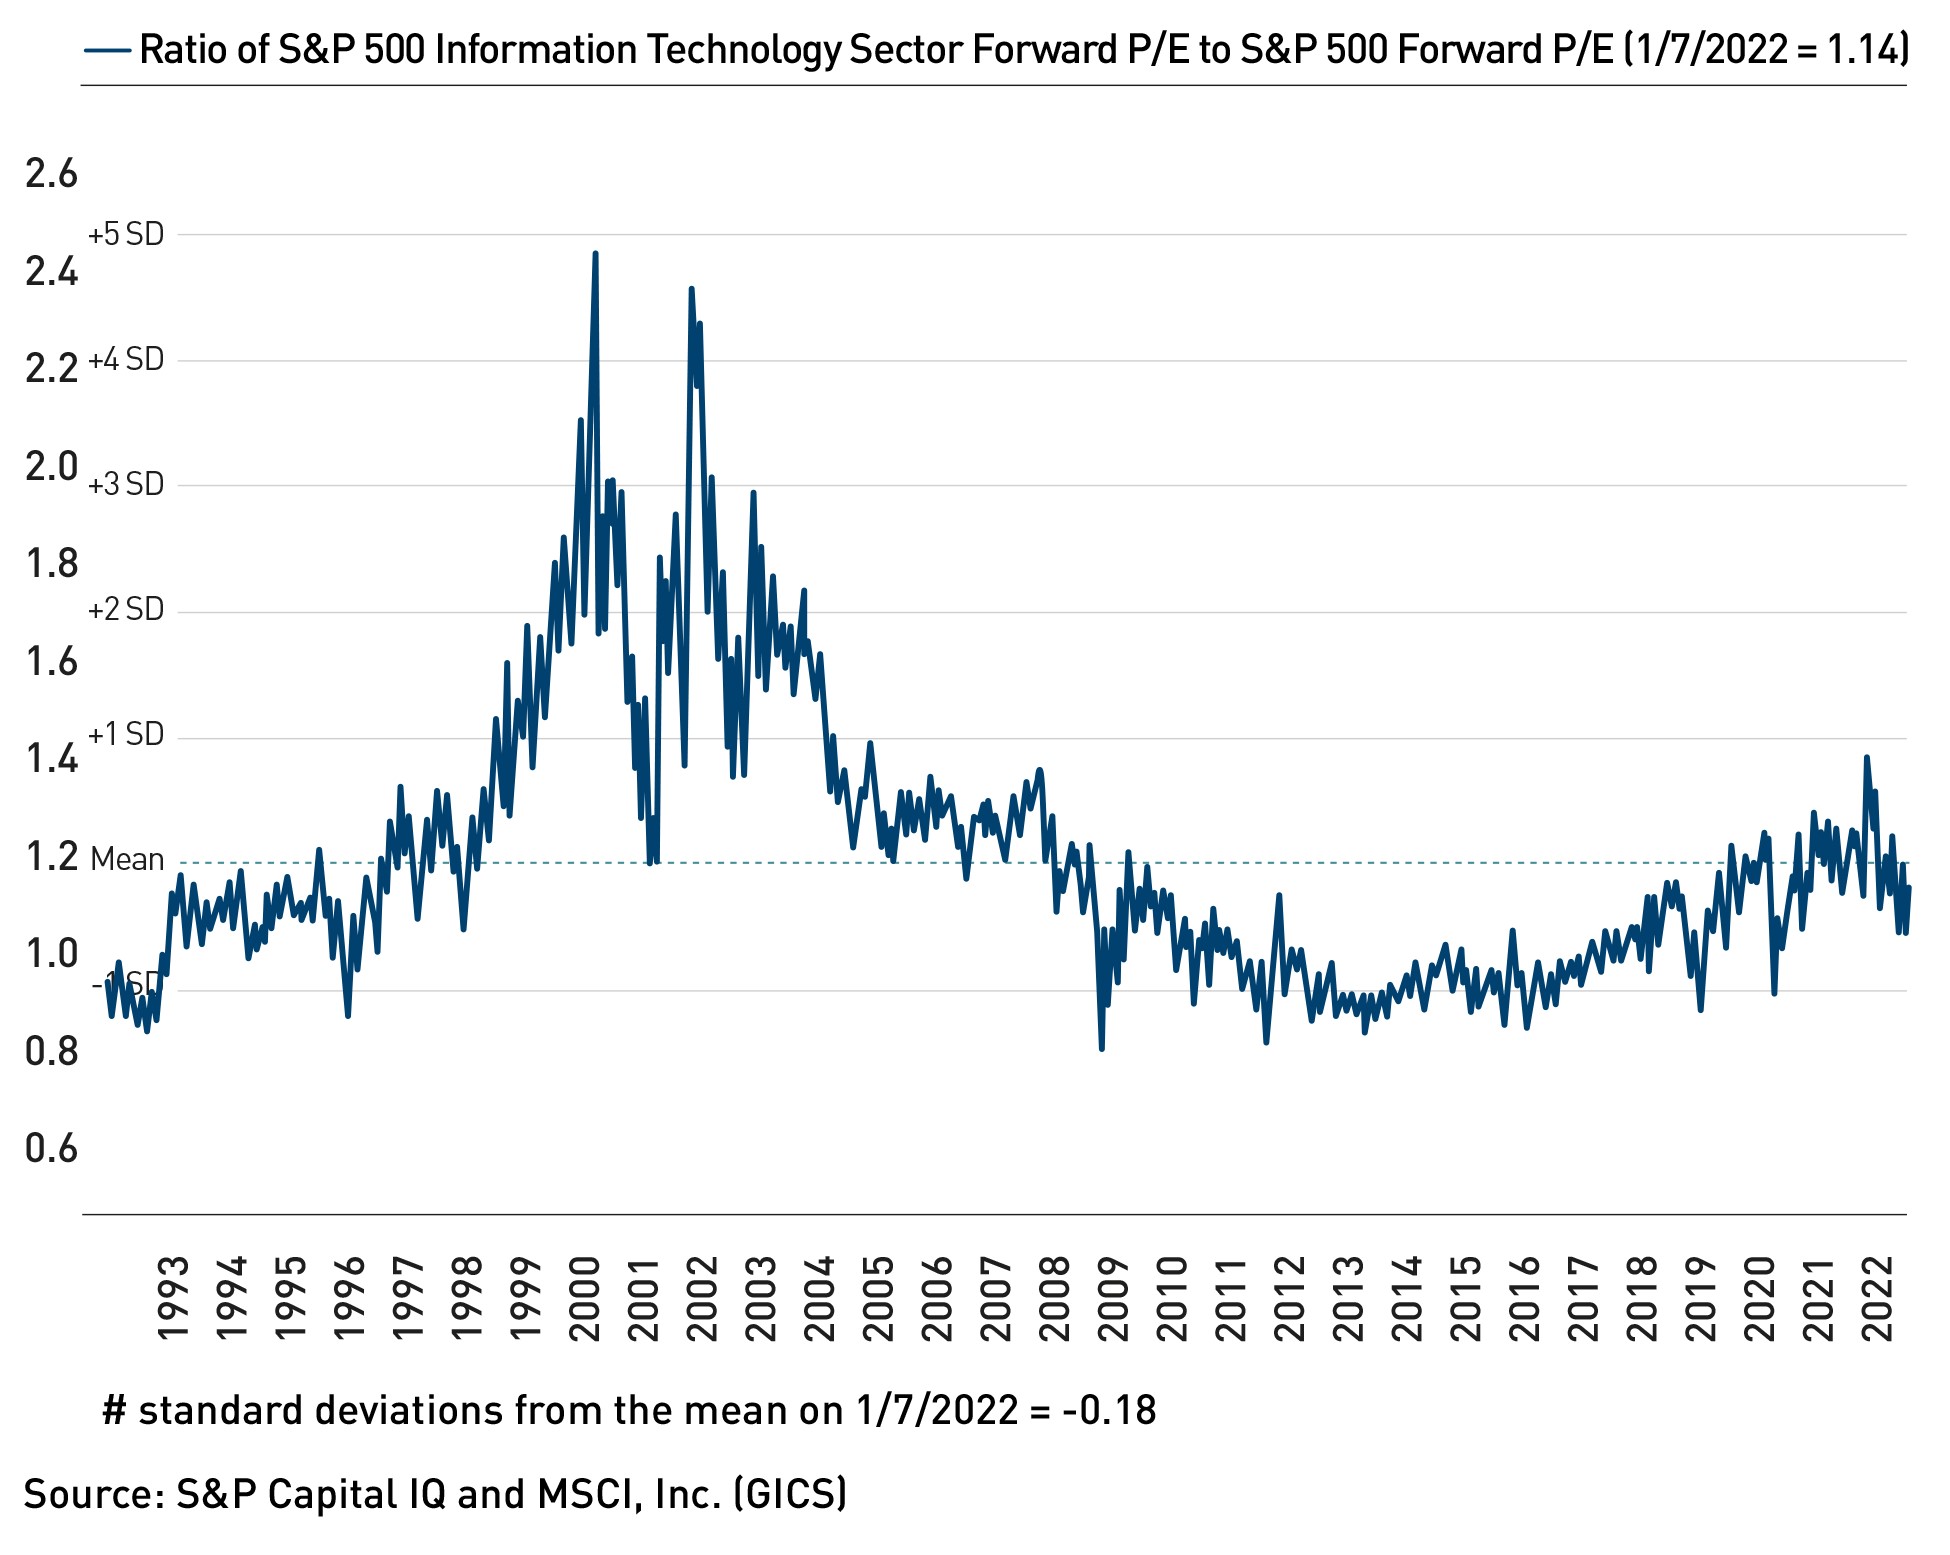
Having made a new cycle high of 28x ahead of the Fed Pivot in November 2021, technology valuations have been in retreat. Today, the forward P/E of the technology sector is c.19 – considerably less than this time last year (26x), below the five-year average (21.7x) but still ahead of the 10-year (18.2x) average. In addition, technology remains the best-capitalised US sector and the only one with net cash. The sector’s relative rating has also contracted from post-2004 highs of 1.4x registered in late 2021. Today, technology stocks trade at 1.1x the market PE multiple, towards the middle of its post-dotcom bubble range of 0.9-1.4x and a far cry from levels seen during the dotcom bubble, when the sector traded at more than twice the market multiple. However, as we have long argued, aggregate valuations continue to be diluted by ‘cheap’ incumbents such as HP and Intel (and now arguably Meta / Facebook) that trade on P/Es of between 7-13x.
Last year, we highlighted how the technology story had hardly gone unnoticed, evidenced by next-generation valuations that had expanded to cycle highs, revisiting levels not seen since the late 1990s. While this group of stocks boasted unusual growth profiles, we cautioned that elevated valuations also reflected several late-cycle features – elevated retail participation, SPAC issuance, concentrated portfolios and ‘classic late-cycle exuberance’ that had coalesced around long-term ‘total addressable market’ (TAM) investing. Since then, those pockets of exuberance have been truly burst including ARK (a proxy for TAM investing) which peaked in February 2021 – a full nine months before our own benchmark made its highs– and has subsequently suffered peak-to-trough decline of c.77%. SPACs have fallen by c.50%. At time of writing, valuations across the SaaS space have more than halved across all growth groups. While we have been nervous about high-growth valuations, our own base case did not envisage a derating that would be as deep or dramatic as it is currently proving; what began as an overdue valuation reset has gathered momentum of its own as investors have begun to question the durability of growth and even the validity of some companies’ non-GAAP profitability given high (and persistent) levels of share-based compensation. While macroeconomics and the Fed pivot have played a significant part in this, it has been the reversing fortunes of the working from home (WFH) and other pandemic beneficiaries that began this process.
Spending Priorities / Favoured Themes
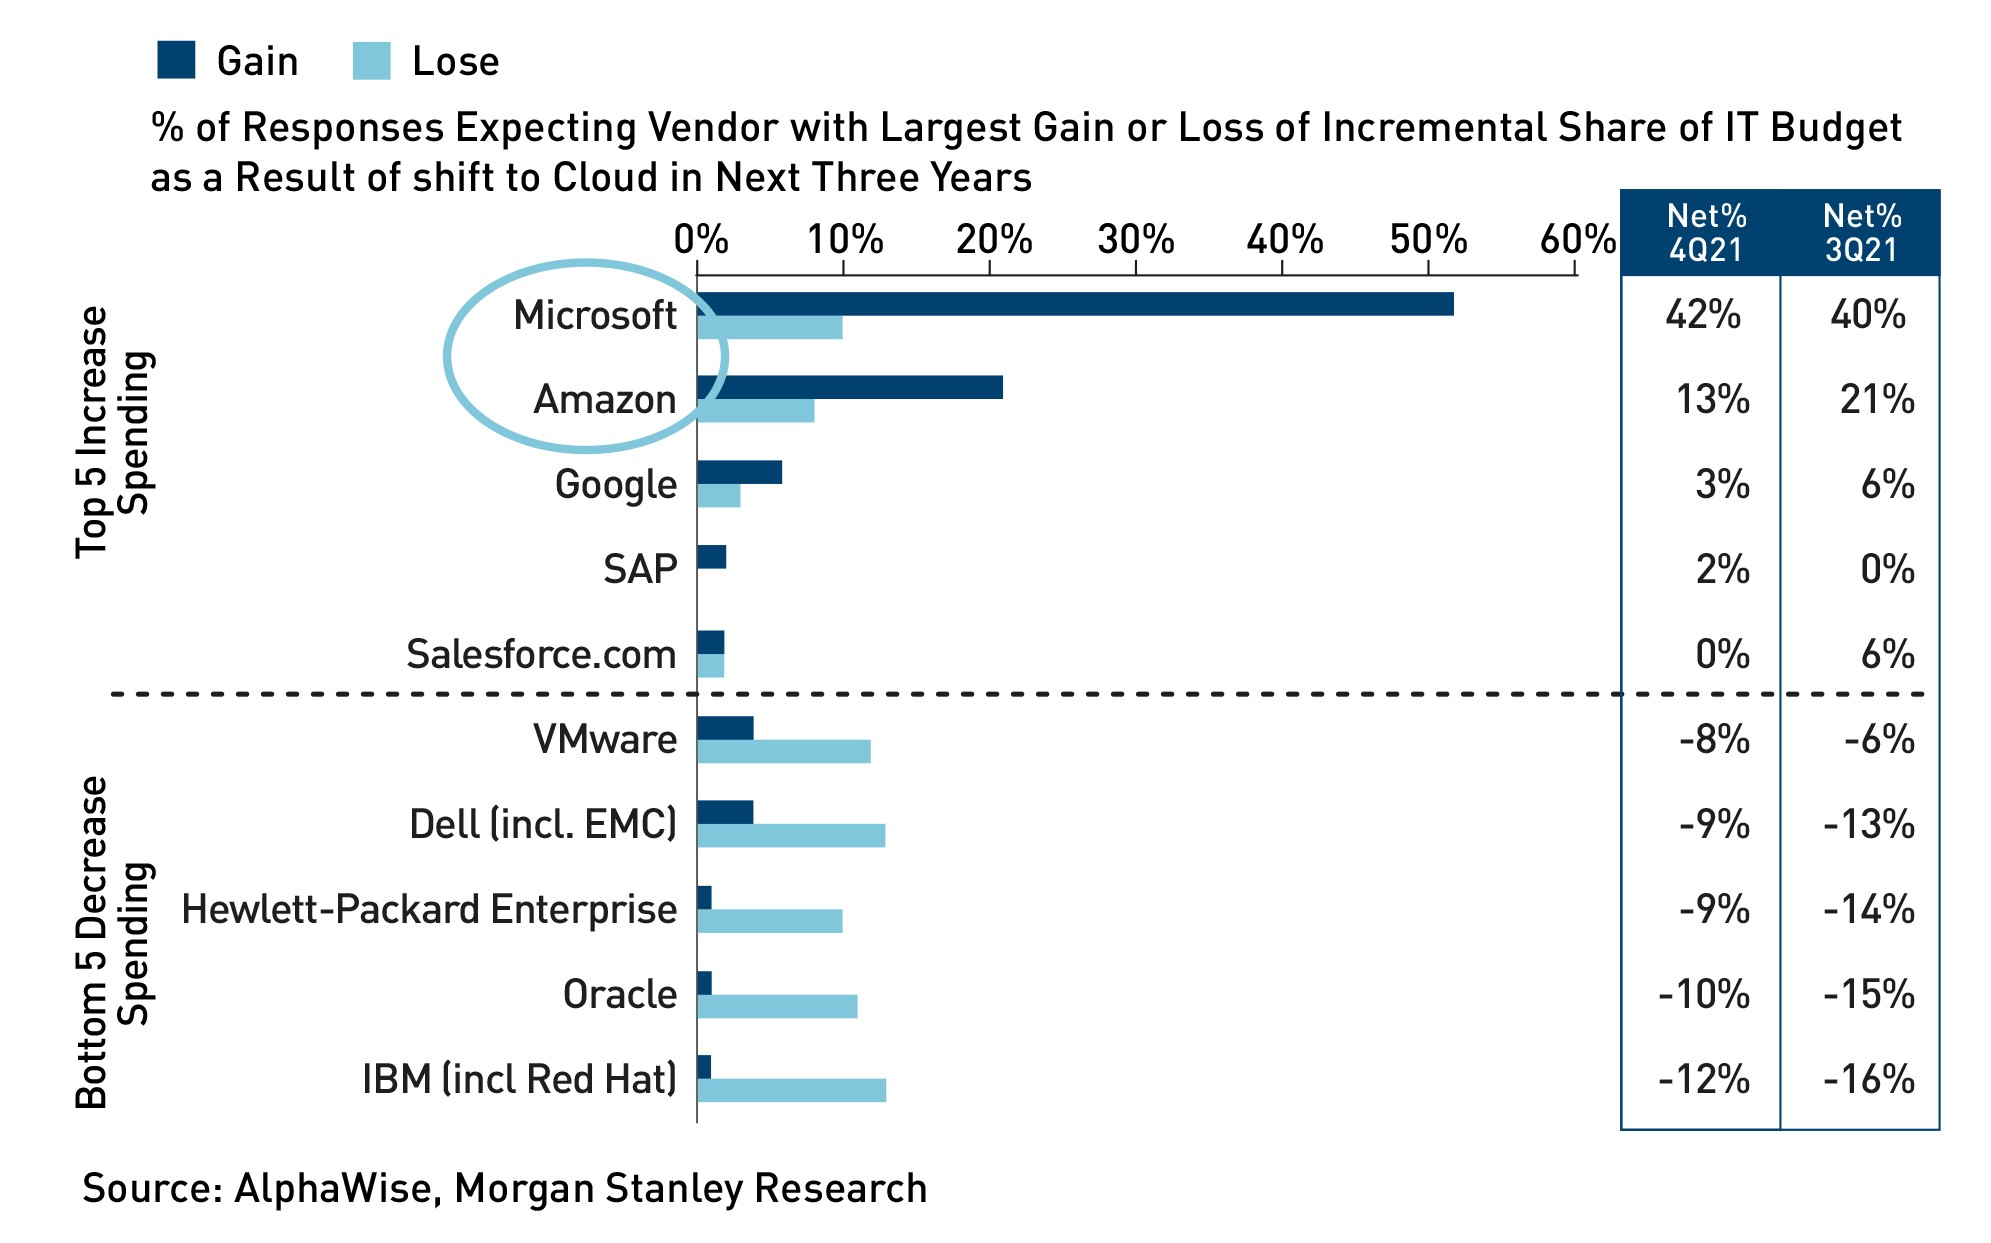
Although next-generation valuations are currently under pressure, IT spending priorities are unlikely to change nearly as dramatically. Indeed, a recent JP Morgan survey of 142 Chief Information Officers (CIO) responsible for $114bn spend expect IT budget growth of +5.3% and +5.7% in 2022 and 2023 respectively, versus c.4.8% expected during the pandemic. The survey (and others like it) support the view that IT budgets continue to be reallocated in favour of new technologies. Cloud computing remains the number one IT priority, while other high priority areas include security, digital transformation, analytics, collaboration, and AI. Demand for IT services also remains strong due to accelerated digital demand and the constrained talent environment. In contrast (and at the margin) there does appear to be some levelling off in spend intentions for communications software likely due to reopening/WFH digestion. Hardware also remains one of the slowest growth areas, with PCs seeing a deterioration in CIO prioritisation post-WFH, while the cloud shift continues to represent significant longer-term risk.
More broadly, and consistent with previous years, legacy technologies, and vendors such as IBM, Oracle and Dell are expected to remain market-share donors despite their best efforts (and M&A) to reinvent themselves. At a time when growth stocks are under sustained pressure, this is a good reminder of why value investing within technology is something of a Faustian pact (and why we avoid it). Instead, we construct our portfolio around seven core themes: internet advertising / ecommerce, software-as-a-service, cloud infrastructure, cybersecurity, data economy / AI, digital entertainment and connectivity/5G. In addition, we have exposure to a number of secondary themes including fintech/ payments, automotive, clean energy, and medical technology. We are also excited about the long-term disruptive potential of emerging themes such as blockchain and the metaverse.
Technology Risks
As ever, there are multiple risks to our constructive mediumterm view. Many of these relate to macroeconomics (recession; inflation; war, and others) that are covered broadly elsewhere. In addition, we should highlight the risk to technology spending should CEO confidence meaningfully deteriorate. Despite survey results suggesting otherwise, there could be some risk to cloud spending should earlier-stage companies/unicorns spend less aggressively. Other ‘big picture’ risks include widespread component shortages and labour market tightness. Valuation is another risk because even after this atypical correction, technology stocks have retraced back to average, rather than cheap territory versus history. While earnings progress is expected to moderate this year, numbers look at risk of downward revision given the weaker global growth outlook and US Dollar strength while record technology margins could be challenged by soaring input prices, tight labour markets and/or reopening (as companies give up or reinvest some of their pandemic savings).
As we warned last year, a steeper yield curve (noticeably absent at present) is unlikely to prove good news for technology stocks. Regulation remains a key risk with events in China after the aborted IPO of Ant a salient reminder of regulatory risk. That said, we are comforted by the existence of due legal process in liberal democracies painfully absent elsewhere. However, we would not be surprised to see a resurgence in regulatory scrutiny in the US post-COVID. While legislation will not be easy to pass, restrictive legislation has already been proposed by members of both parties that focus on app stores, first party/third party seller conflicts and responsibility for content on internet platforms (revising Section 230). We expect ‘Big Tech’ and their natural monopolies to continue to invite scrutiny and the drumbeats in Washington to grow louder over the coming year ahead of key lawsuits slated for 2023.
Concentration Risk
In addition to market and sector specific risks, it would be remiss of us not to remind our shareholders about the concentration risk both within the Trust and the market cap weighted index around which we construct the portfolio. At the end of June, our three largest holdings – Microsoft, Apple and Alphabet – represented c.28.5% of our NAV and c.41.3% of our benchmark respectively. Five years ago, our top three positions (Alphabet, Apple and Microsoft) accounted for c.22% of NAV and c.30% of our benchmark. The higher concentration of both our portfolio and benchmark reflects the spectacular performance of a handful of stocks that captured the zeitgeist of this cycle. These are unique, nonfungible assets and their long-term success represents their dominance of their respective industries in an interconnected world where network effects are paramount, and the marginal cost of distribution is low. Their influence is not only felt within technology indices; at the end of June, the largest ten stocks (including these three) in the S&P 500 accounted for 28.0% of its market cap. While off recent highs, this level of concentration is commensurate with levels not seen since the early 1980s. Although this makes the portfolio (and indices) more sensitive to the performance of a few stocks, we are encouraged by the fact that the largest ten stocks also explained 29% of index earnings as at year end. Trading at/around a market multiple, these stocks dominate market cap indices because of their earnings progress, rather than because they sport outlandish valuations as was the case in the late 1990s. We are very comfortable moving materially underweight them should we become concerned about their growth or return prospects, or should we find more attractive risk-reward profiles elsewhere in the market.