Investment Manager’s Report: Summary
An extract from the full Investment Manager’s Report
The financial information set out below does not constitute the company's statutory accounts for the years ended 30 April 2026 or 30 April 2025 but is derived from those accounts. Statutory accounts for 2025 have been delivered to the registrar of companies, and those for 2026 will be delivered in due course. The auditor has reported on those accounts; their reports were (i) unqualified, (ii) did not include a reference to any matters to which the auditor drew attention by way of emphasis without qualifying their report and (iii) did not contain a statement under section 498 (2) or (3) of the Companies Act 2006.
The full Annual Report and Financial Statements for the Year Ending 30 April 2026 can be found here.
Market Review
Equity markets delivered a third consecutive fiscal year of gains in the 12 months to the end of April 2026, with global and US indices both returning 28.8%, in sterling terms, including dividends. This capped an extraordinary three-year run in which the S&P 500 doubled from its October 2022 lows. Most major markets posted strong fiscal year 2026 (FY26) returns, flattered by April 2025 volatility around Liberation Day tariff uncertainty and the subsequent relief rally as reciprocal tariffs were paused.
Having entered the year with near-record country (US), sector (IT) and stock ('Magnificent Seven' (Mag7)) concentration, FY26 finally rewarded diversification – Europe (+21.6%), Japan (+28.1%) and South Korea (+148%) all delivered strong returns. Much of the ex-US performance reflected multiple expansion as the long-standing US premium, even adjusted for growth, narrowed. In the US, company valuations remained elevated versus history and returns were almost entirely driven by earnings. The dollar weakened by 1.7% versus sterling during the fiscal year, while the trade-weighted US dollar spot index (DXY) declined by 1.4%.
While US stock-level returns were narrow, sector returns showed greater breadth. Technology still delivered strongly in the US, while financials and miners staged a powerful recovery in Europe, partly as AI capital expenditure (capex) spilled into infrastructure-related areas. Rising single-stock volatility also gave active managers greater scope to add alpha.
FY26 was defined by robust global growth, central bank interest rate cuts, upside to AI capex and growing optimism over the broader tailwinds from AI adoption. Markets climbed the proverbial 'wall of worry' as tariff concerns and erratic policy kept uncertainty levels elevated.
The One Big Beautiful Bill Act (OBBBA), passed in early July 2025, delivered substantial stimulus via corporate tax cuts and investment incentives. Financial conditions stabilised as Middle East tensions eased, inflation moderated and labour markets cooled, prompting the Federal Reserve (Fed) to resume cutting interest rates in September. Consumer spending proved resilient, led by higher-end consumers, and the labour market held up despite tariff and policy uncertainty. Inflation ran slightly above the Fed's 2% target, but did not re-accelerate as feared, allowing three further 25 basis point (bp) rate cuts in the second half of 2025.


Ben Rogoff
Partner, Technology
Alastair Unwin
Partner, Deputy Fund Manager
Late summer and autumn brought fluctuating rate expectations and a prolonged US government shutdown, triggered when Congress missed the 30 September appropriations deadline. At 43 days, it was the longest in US history, ending on 12 November. Sentiment was tested by pockets of credit stress and renewed tariff threats, particularly around Chinese rare earth export controls. Fed Chair Jerome Powell publicly clashed with President Trump over the pace of cuts and Fed independence. Momentum stalled in Q4, though equities held up, supported by resilient company earnings, easing inflation, supportive monetary policy and continued strength in AI-related capex.
Early 2026 saw a sharp rotation in equity markets from growth to value, secular to cyclical, asset-light to asset-heavy, US to ex-US. AI disruption risk came into acute focus in late January as weaker-than-expected results from Microsoft, SAP and ServiceNow were poorly received against an inflection in coding capabilities from Anthropic's Claude Code. Terminal value concerns caused technology stock valuations to fall sharply, driving the software sector's forward price to earnings (P/E) ratio from 35x to below 20x (i.e. investors previously willing to pay £35 for every £1 of earnings are now paying less than £20).
AI concerns spread to data-intensive industries and intermediaries – media; information services; brokers; business services – and Goldman Sachs' AI-at-risk basket was down 22% year to date by mid-February. Even traditionally resilient, high-quality businesses weren't spared, posting their steepest 12-month losses since the pandemic. Conversely, cyclicals and consumer industries rallied as the ISM Manufacturing Index turned positive and the premium investors would pay for perceived 'AI defensibility' expanded. This resulted in an increase in market breadth and dispersion. The consumer staples sector – seen as sheltered from AI – reached the same valuations as technology, a sector that delivered one of its weakest starts to a year in five decades.
Geopolitical uncertainty rose sharply in the final months of the fiscal year. A US military buildup in the Middle East culminated in coordinated US and Israeli strikes on Iran in late February, raising concerns about wider regional conflict and disruption to traffic through the Strait of Hormuz. The conflict injected significant uncertainty around inflation, growth and the path of monetary policy, driving demand for safe-haven assets as the oil price rose to a multi-month high. The final weeks delivered a sharp reversal. On 8 April, President Trump announced a two-week ceasefire which held in some form through to the end of the month, and investors rushed back into AI stocks despite tighter financial conditions and a less favourable rate outlook.

Current Base Management Fee Arrangement:
effective 1 May 2022
| 0.80% | £0 - £2bn |
| 0.70% | £2bn - £3.5bn |
| 0.60% | over £3.5bn |
Base Management Fee Arrangement:
to 30 April 2022
| 1% | Up to £800m |
| 0.85% | £800m - £1.6bn |
| 0.80% | £1.6bn - £2.00bn |
| 0.70% | over £2.0bn |
Technology Outlook
AI driving accelerating IT budgets
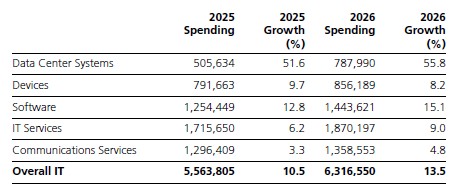
Calendar year 2025 delivered one of the best years for IT spending in recent history at 10.5% growth, exceeding earlier expectations of 9.8% and well ahead of 7.7% in 2024. Together, these two years represent the strongest back-to-back growth since 1995-96. All the upside to Gartner's January 2025 forecast came from data centre systems, which grew 52% year on year (y/y) versus expectations of 23%. Other categories came in line or light of this.
For 2026, worldwide IT spending is forecast to remain strong at 10.5% y/y, with growth more clearly skewed towards AI as model and agentic progress drive enthusiastic enterprise adoption following disappointing early gains from copilots. Data centre systems are now expected to exceed $780bn in 2026, up from earlier expectations of $650bn. Software is forecast to accelerate to 15.1% y/y, though this includes GenAI (generative AI) model spending growing 80%. Device spending is expected to decelerate to 8.2%, partly due to rising memory prices and extending replacement cycles.
CIO surveys consistently rank AI as the top IT priority for 2026. Citi's Q4 2025 survey placed AI first, ahead of cybersecurity, digital transformation and robotics/automation. Jefferies estimates 12% of IT budgets are now allocated to AI, up from 6.5% in its previous survey, with 24% of CIOs now delivering production use-cases per Citi. Rising confidence in productivity gains likely explains why 63% of CIOs expect AI-related spending to affect hiring plans.
Source: Gartner (April 2026)
Earnings growth
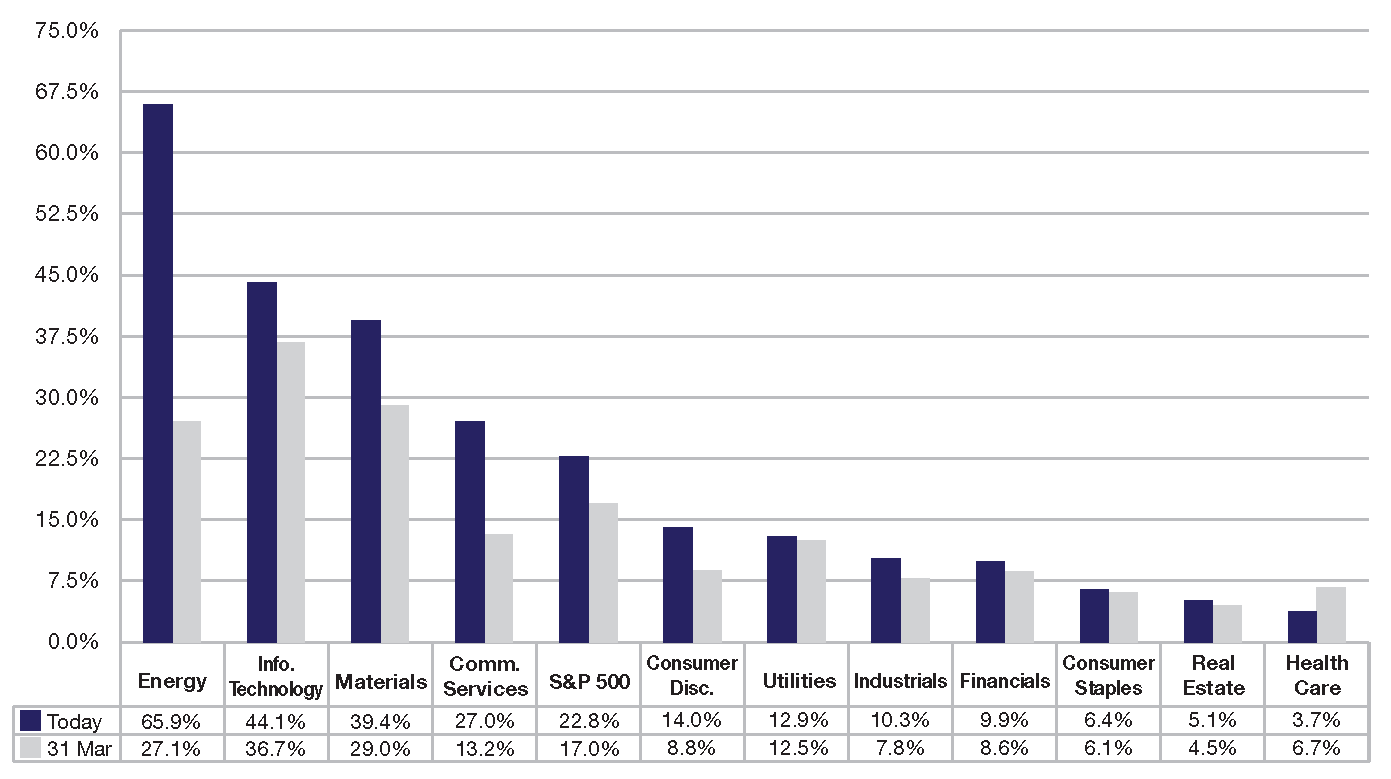
For calendar year 2026, the S&P information technology sector is forecast to deliver revenue and earnings growth of 28% and 48% respectively, well ahead of the wider market's 10.8% and 22.9% (although earnings growth is flattered by some unrealised investment gains, e.g. in SpaceX and Anthropic stakes). Outperformance is expected to extend into 2027 with revenue and earnings growth of 17.7% and 24.7% compared to 6.9% and 13.7% for the broader market. While these forecasts might appear at odds with elevated geopolitical uncertainty, the AI imperative and corporate earnings have thus far proved more resilient than feared.
First-quarter reporting season has been supportive with blended earnings growth of 30.7% y/y, though headline numbers mask significant subsector divergence – semiconductors (+49%) doing much of the heavy lifting while others delivered more modest growth.
The most significant risks to the sector's earnings profile are geopolitics, AI disappointment and concentration risk (the Mag7's outsized share of sector earnings). Large FX moves would also have a disproportionate impact – technology has the highest international revenue exposure of any S&P 500 sector at 55% versus the S&P 500 average of 39%.
Source: FactSet
Valuation
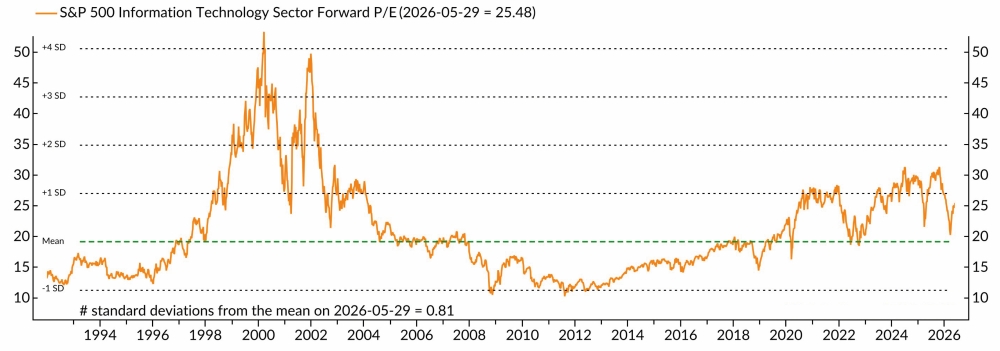
Technology's valuations expanded modestly through most of the past year, but recent pronounced weakness in software and internet stocks – groups perceived as AI losers – has driven a contraction in headline valuations. The sector now trades on a 25.1x forward earnings, down from 26.3x last year and sits between five (25.5x) and 10-year (24.3x) averages. The S&P 500's current forward P/E of (c.21x) remains elevated by historical standards, at a level seen only a handful of times in recent history (2021 and 1998-2000).
On a relative basis, technology's P/E trended lower for much of the past year. More recently, AI disruption fears, coupled with a robust Q4 earnings season, triggered a sharper derating. However, subsequent sector strength has seen the sector's relative P/E recover to 1.2x, its 20-year average.
Repricing AI risk
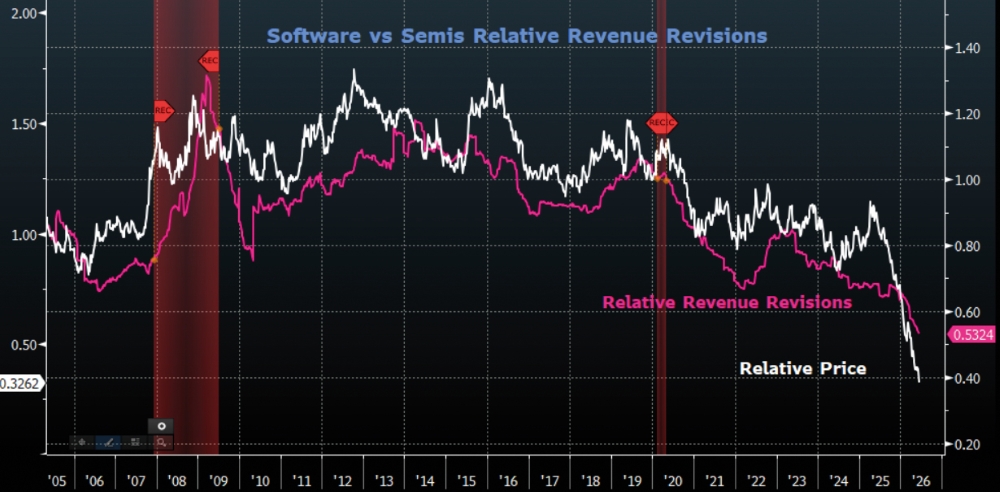
Headline valuations belie record subsector divergence, as AI disruption has created clear winners and losers. Those perceived as benefitting from AI – particularly chip makers – have reached valuations not seen since early 2021 while software recently traded at its lowest valuations since 2016. The software plunge saw almost 80% of stocks suffer a >30% drop, almost unheard of outside cyclical bear markets. To us, this feels less like a sudden dislocation rather than an overdue reaction to fundamentals that have been diverging from semiconductors since at least 2020. We remain significantly underweight software and the internet on long-held concerns about their relevance in an AI-first world.
Source: Ned Davies, S&P DJ Indices and MSCI (GICS)
Source: Baird/Bloomberg
Mag7 challenged
After years of sharp outperformance, Mag7 returns have been moderating. In 2025, only NVIDIA and Alphabet outperformed the S&P 500, reflecting diverging AI fortunes. The group now accounts for 31% and 25% of the S&P 500 market cap and forward earnings respectively, compared to 29%/22% a year ago.
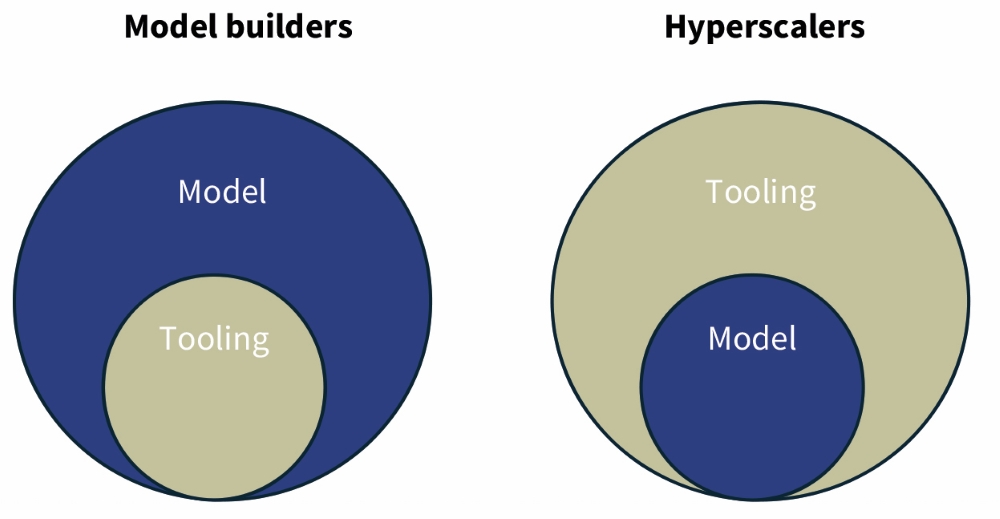
The premium valuation enjoyed by this remarkable group of natural monopolies is now being challenged by a combination of prosaic and potentially existential factors – converging growth rates, elevated AI investment and rising capital intensity. While we believe current hyperscaler capex is rational and in long-term shareholder interests, interest alignment will be challenged near-term as hyperscalers – particularly those without frontier models – become asset-heavy 'quasi-utilities'. Against this backdrop, the absence of tangible AI benefit is likely to result in capex being increasingly perceived as defensive.
We see agentic AI as a threat to existing cloud platforms, especially those without a frontier LLM (large language model) and/or their own chips. The LLM is the 'brain' of any agentic system. Without a frontier model, cloud platforms may cede the most lucrative part of the AI value chain – the orchestration layer – and with it application programming interface (API) revenue and control over the 'scaffolding' of core tools and management infrastructure. AI also threatens other massive profit pools – advertising (a $1trn market by 2028 dominated by Google, Meta and Amazon), e-commerce (Amazon accounts for 40% of US online retail) and software (Microsoft's 72% PC of the operating system market and 450 million productivity software users).
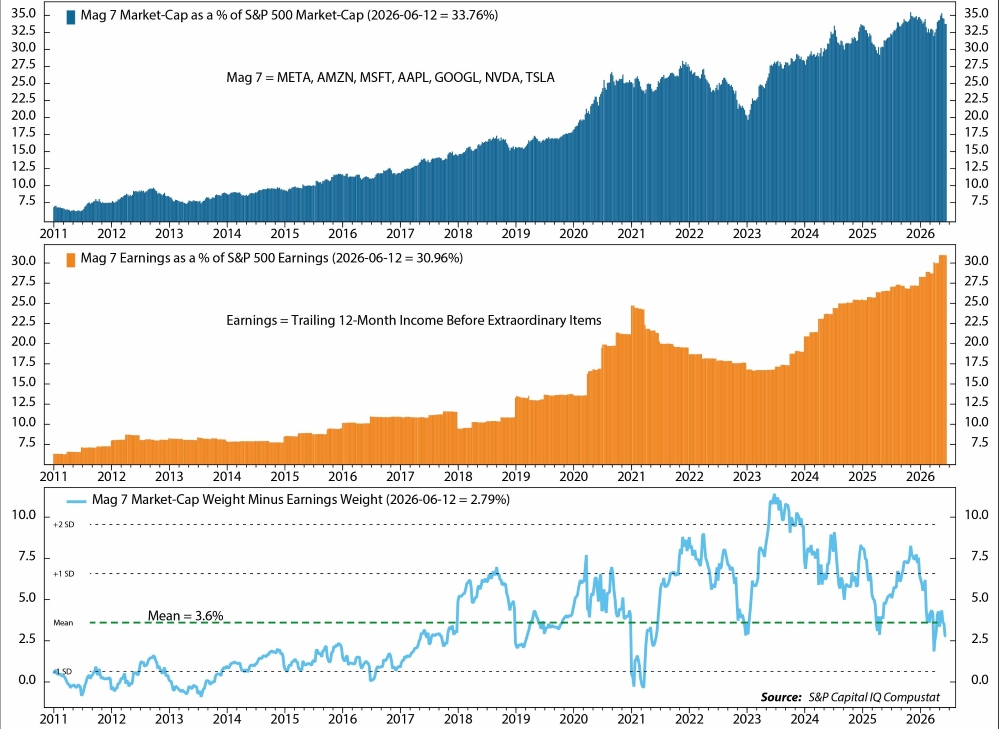
Source: Ned Davis, S&P Capital IQ Compustat
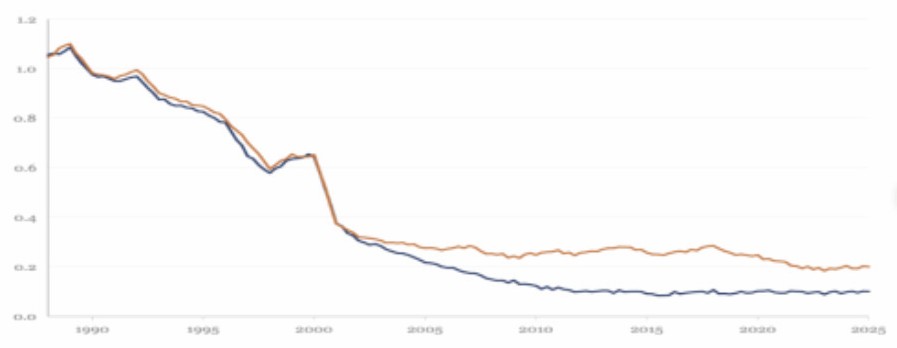
Source: NDR
The absence of a frontier model is a key reason we have become considerably more cautious on Meta and Microsoft, and why we meaningfully increased Alphabet exposure (which also has its own competitive chip) ahead of and after Gemini 3. There are still many ways for each Mag7 company to 'win' in the AI era, but the range of outcomes has shifted. Apple remains an outlier, lacking a frontier model but spending modestly on AI capex, and we wonder if the company might change tack once Tim Cook steps down as CEO in September.
In The Magnificent Seven (1960), only three of the seven gunfighters survive. We suspect the Mag7 trade may be approaching a similar moment and for those competing directly, they obviously cannot all win, even if the overall return on investment for AI is very positive.
Mag7 now accounts for 29% of the portfolio versus >50% of the benchmark. The burden of proof has shifted onto incumbents to demonstrate their relevance in an AI-first world. We expect to exit anything we believe to be impaired, holding significantly smaller equity positions in incumbents augmented with out of the money (OTM) call options to protect against significant rallies.
Implications of a post-Mag7 world
Aside from 2022, the Mag7 has outperformed the S&P 500 in nine of the past 10 calendar years. Should recent underperformance extend, the investment ramifications would be significant – some are already unfolding.
After another exceptionally narrow market in 2025 (only 30% of S&P 500 stocks beat the index), we are hopeful the backdrop becomes more active-manager friendly. This may take the form of improved breadth – the recent low in the Russell 2000 vs S&P 500, back to levels last seen around 2000, feels like a significant portent and a potential moment for small-cap companies to reassert themselves. We are also intrigued by the potential for AI tool use to materially increase the audience for smaller businesses by helping discovery and analysis.
Source: Rothschild & Co Redburn
Change of leadership?
We are even more excited about a potential change of technology leadership as the AI cycle extends. This long-held view was recently supported by a fascinating spike in the S&P Information Technology High-Low Logic Index, which measures the number of technology stocks simultaneously making new highs and lows. The index recently surged to 11.3, by far its highest reading since 1972, with prior peaks between 5.0 and 7.0 during the early and late 1990s. What it measures is breadth divergence: the IT sector at peak relative highs versus the S&P 500 with internal breadth is the most fractured ever. We believe this represents AI disruption, with semiconductors and infrastructure surging to new highs while software, IT services and internet break to new lows. At the headline level things look fine; beneath that, we see a sector in turmoil.
While others continue to push the dot.com parallel, the high/low reading looks more akin to the technology leadership rotations of the early 1990s PC cycle.
The PC cycle parallel
Like the AI cycle, the early 1990s PC cycle was hardware-driven and enabled by scaling laws. IBM's 1981 PC quickly became the standard business microcomputer. The fateful decision to use an Intel microprocessor was reframed by Moore's Law and Intel's merchant volumes. Intel's fifth-generation Pentium (1993) unlocked a processing throughput bottleneck much as HBM has enabled training of massive AI models, while Windows 3.1 (1992) sold three million copies in its first two months and turned the PC into a viable platform.
PC units grew from 24 million to 150 million between 1990 and 2000. Microsoft's revenues increased 30x between 1986 and 1995 at 25% net margins, and its market cap grew roughly 70x in nine years from IPO, overtaking IBM in early 1993 despite generating a fraction of its revenue – highly reminiscent of recent growth inflections at OpenAI and Anthropic. The incumbents, meanwhile, were in freefall: IBM posted an $8bn loss in 1993, the largest in US corporate history; DEC, the world's second-largest computer company in 1988, lost money in almost every year between 1991 and 1996; Wang Laboratories, which had controlled up to 80% of office word processing, filed for bankruptcy in 1992.
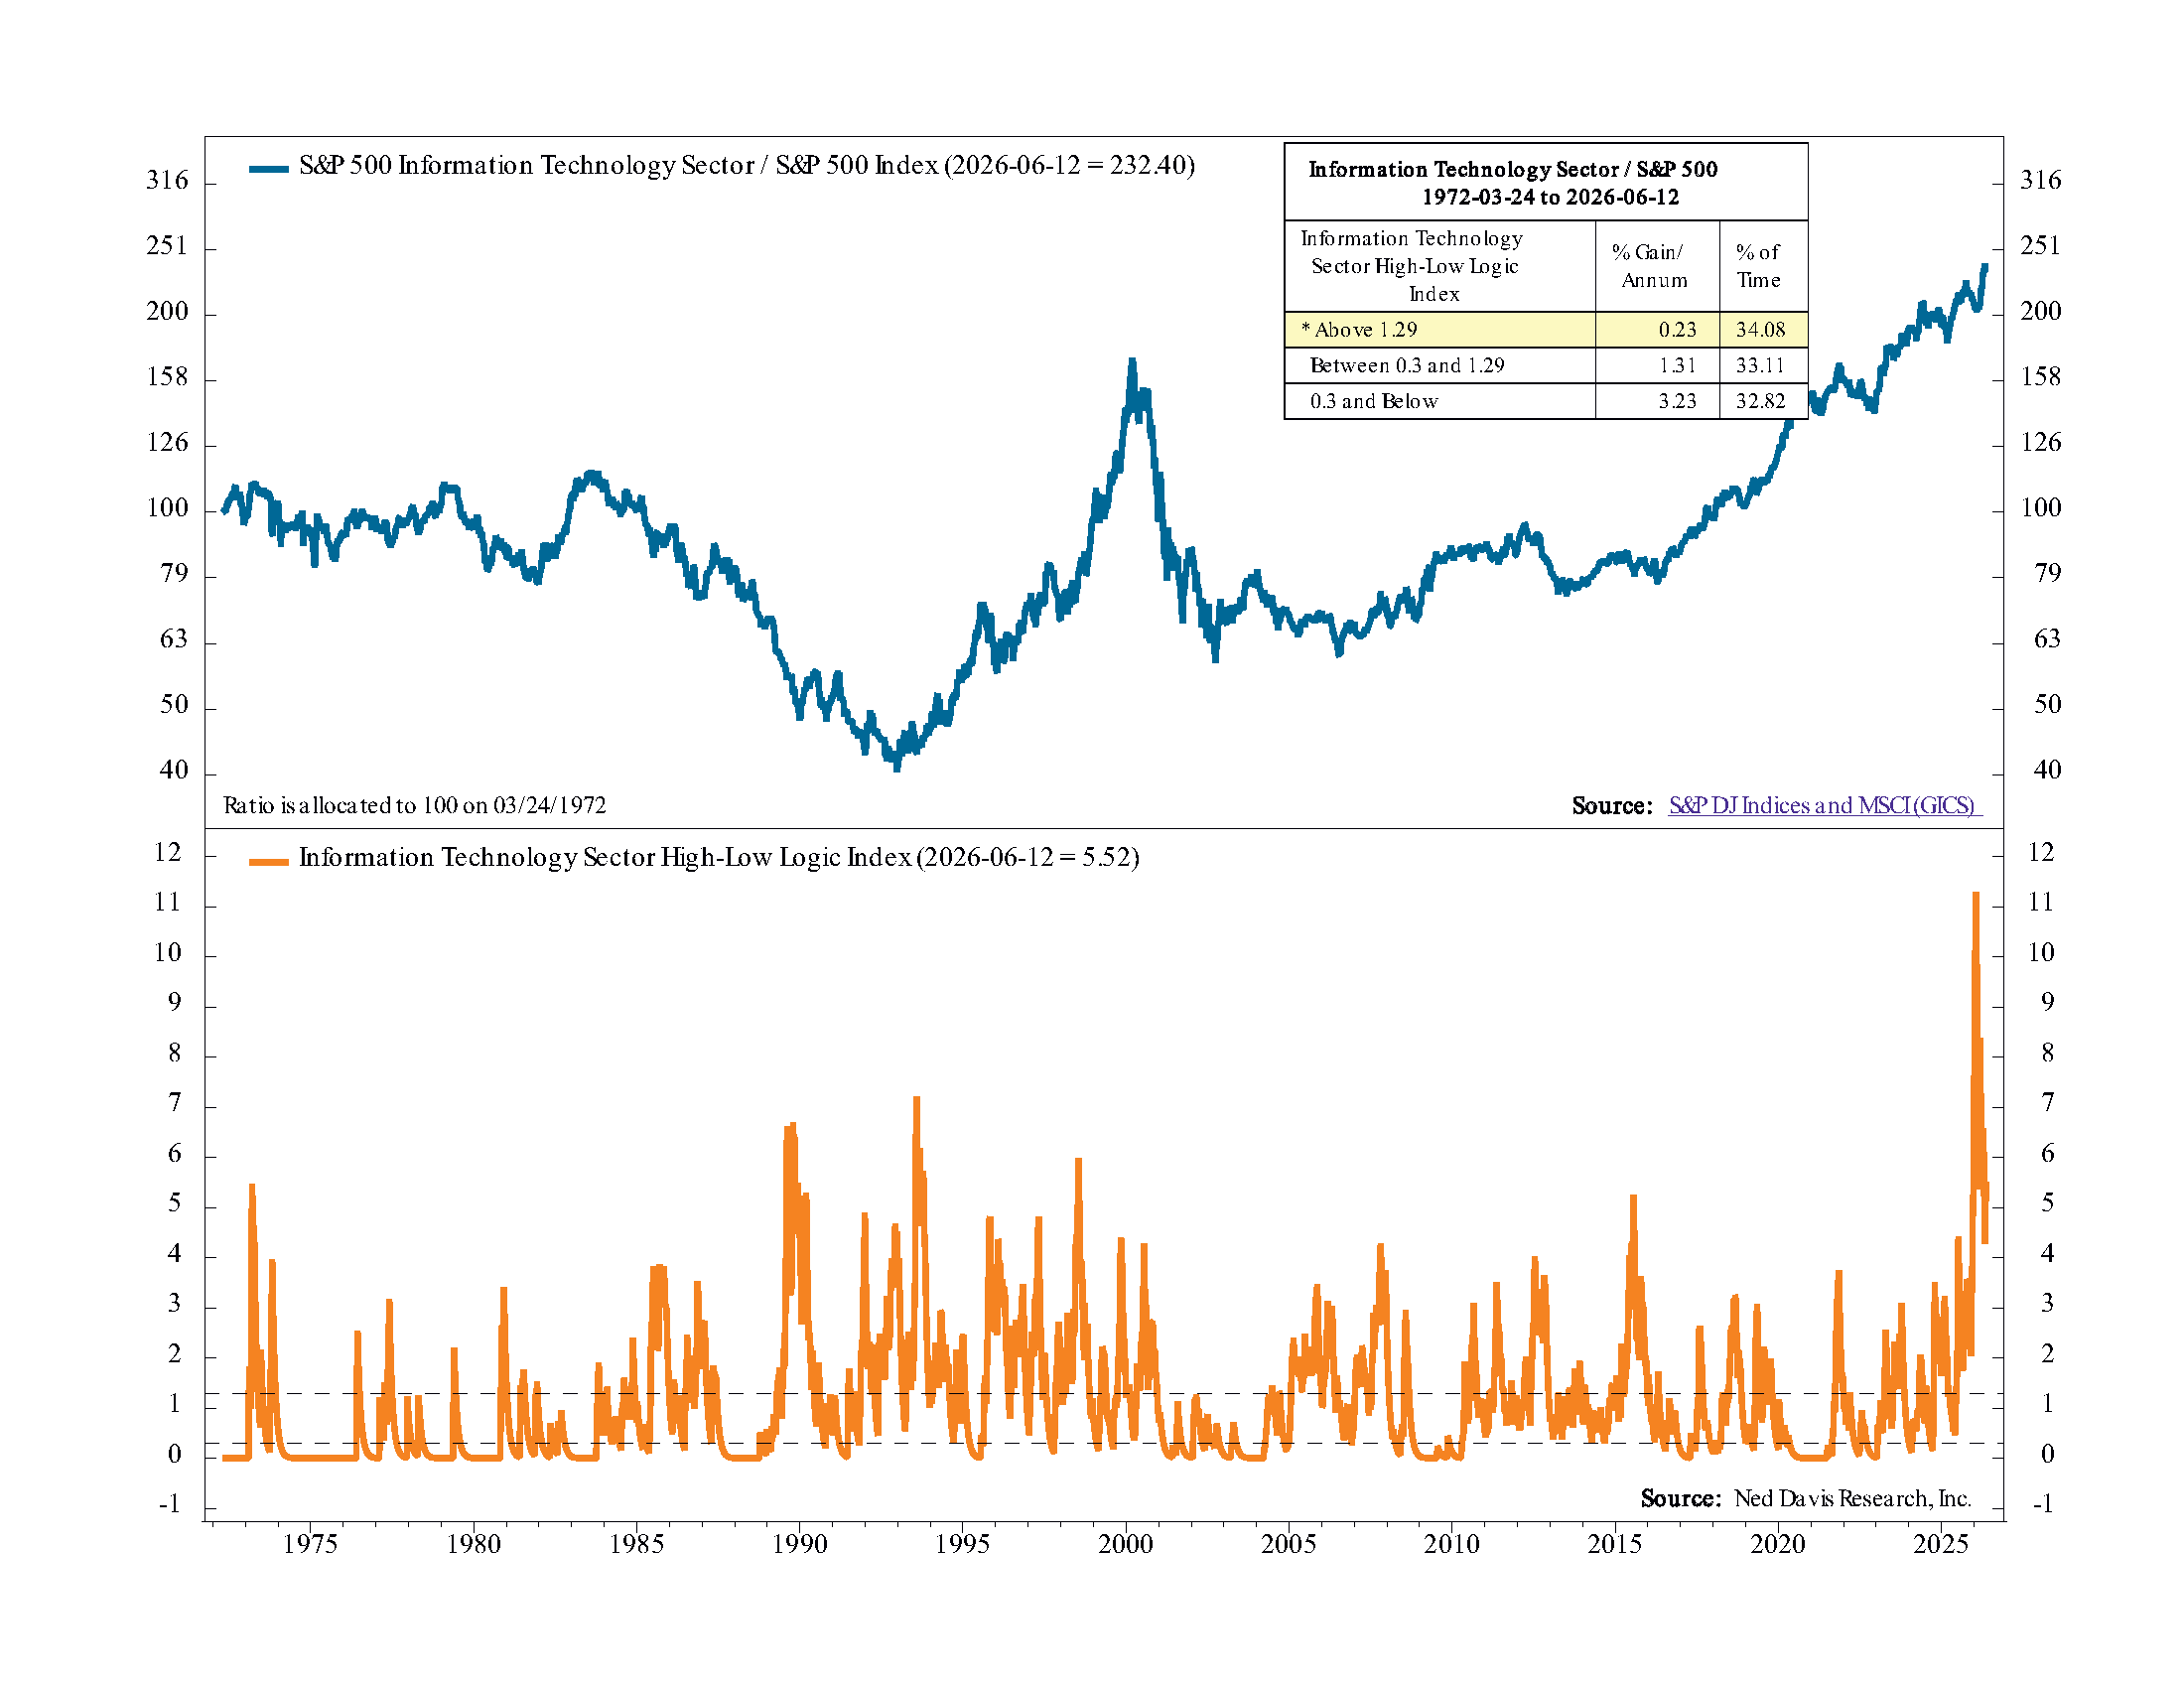
Source: Ned Davis, 20 February 2026
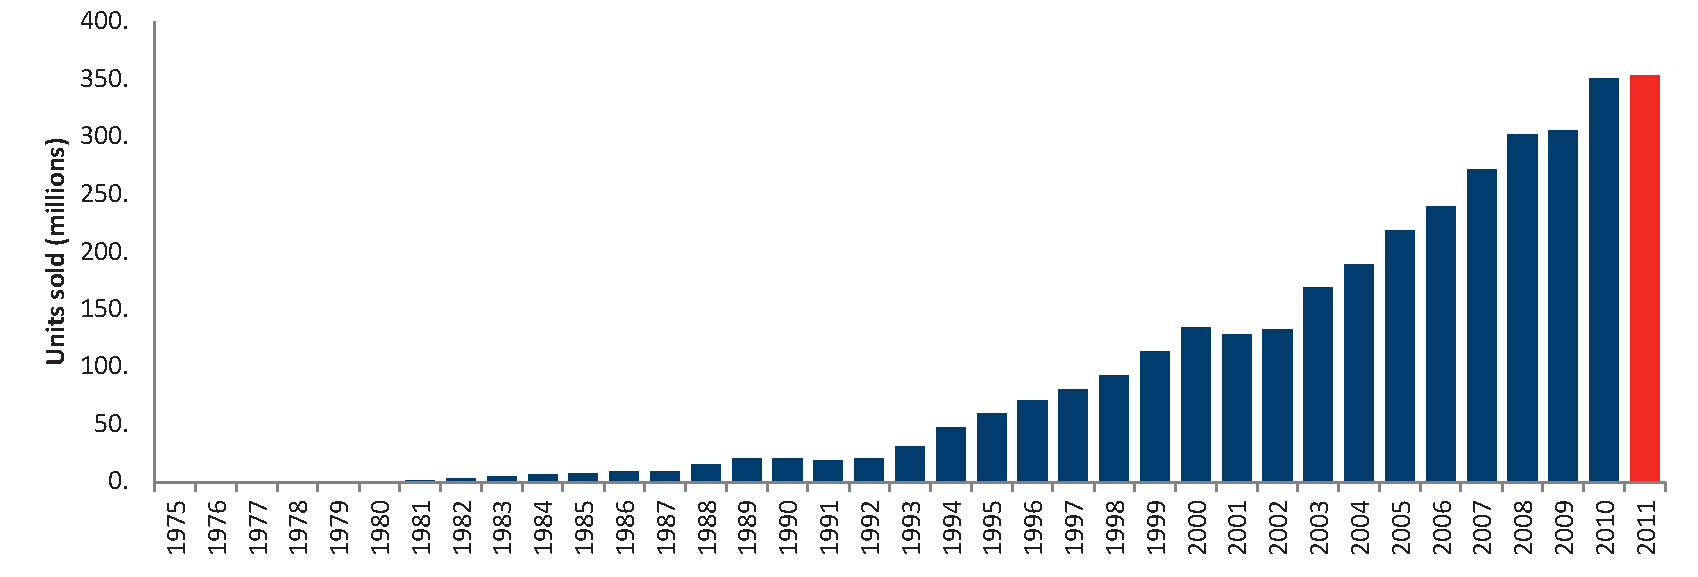
Sources: Jeremy Reimer, “Total Share” (1975–1993); Gartner / IDC worldwide PC shipments (1994–2011).
What lessons might we learn from the PC cycle?
1. Rapid leadership change: In 1993, IBM's share price halved and its market cap fell below Microsoft's for the first time, despite IBM generating $62bn in revenue to Microsoft's $3.8bn. PC and client-server winners rapidly usurped incumbents within indices, years before fundamentals 'justified' the rotation.
2. New (invisible) market opportunities: Early PC winners were later augmented by software applications (Adobe; Corel), utility vendors (Symantec; Norton), networking (3Com; Novell) and an entirely new gaming hardware layer. In 1993 – the same year IBM posted the largest loss in US corporate history – Jensen Huang founded NVIDIA and ATI (now AMD) listed in Toronto.
3. Moving up the stack: Having established Windows as the platform, Microsoft systematically moved into applications. Lotus 1-2-3 was displaced by Excel; Novell NetWare's networking dominance evaporated when Windows NT (1993) added built-in networking; WordPerfect, Borland and Netscape each dominated their category until Microsoft leveraged its platform to enter, bundle and win. Anthropic's recent moves into tool use, computer use and model context protocol (MCP) connectors look less like feature additions and more like the early stages of a Microsoft-style platform expansion from model provider toward the application layer.
4. Architectural shift: The PC cycle is usually framed as the natural successor to previous hardware cycles – mainframe to minicomputer to PC – but it represented something more fundamental: vertically integrated computing was replaced by a horizontally layered alternative where Intel owned the processor, Microsoft owned the operating system and commodity assemblers owned the box. Value migrated from integration to specialisation, hardware to software, proprietary to open. The PC democratised computing but destroyed every incumbent built on a vertical moat.
AI is following a similar pattern of misidentification. It is widely articulated as the natural successor to the cloud because both are scaled forms of computing delivered remotely. However, the underlying stack is profoundly different: parallel rather than serial, power-hungry rather than power-efficient, with model builders adopting heterogeneous approaches to architecture, training, inference and power. Before AI, the unit of compute was the server; today it is the rack and tomorrow it may be the data centre itself. AI may democratise cognition, but the infrastructure required is anything but commoditised. The AI cycle is therefore likely to look less like on-premise to cloud – which destroyed branded hardware but preserved much of the existing software stack – and far more like mainframe to PC, which destroyed the incumbents entirely.
5. Greater competition: Investors should brace for significantly greater competition. The new cycle has created a window for entrants to displace incumbents. Microsoft may have felt it covered its bases when it invested (brilliantly) in OpenAI back in 2019, just as IBM may have done when it launched its PC in 1981. However, the PC cycle shows that revenues, installed bases, brands and customer loyalty count for little when an architectural shift renders technical foundations obsolete. Lotus had the dominant spreadsheet. WordPerfect had the dominant word processor. Novell had the dominant network. None of it mattered. Current debates about near-term software model challenges look remarkably small relative to AI's likely disruptive impact on existing clearing prices and digital profit pools over time.

Current Base Management Fee Arrangement:
effective 1 May 2022
| 0.80% | £0 - £2bn |
| 0.70% | £2bn - £3.5bn |
| 0.60% | over £3.5bn |
Base Management Fee Arrangement:
to 30 April 2022
| 1% | Up to £800m |
| 0.85% | £800m - £1.6bn |
| 0.80% | £1.6bn - £2.00bn |
| 0.70% | over £2.0bn |
End of US exceptionalism?
This might partly explain why US market leadership is waning. The Company is at its largest US underweight in many years, principally from reducing software/internet exposure and reinvesting in semiconductors/hardware assets in Japan, South Korea and Taiwan, as well as in the US.
However, all is not lost for US technology. America enjoys strong or dominant positions in AI chips, storage, power, optical networking and other components, and is winning the frontier model race led by Anthropic, OpenAI and Google. Beyond AI, the US holds strong positions in aerospace/defence, space, autonomous vehicles and humanoid robots.
This is likely to become more apparent as the IPO (initial public offering) market recovers following another subdued year. The outlook for issuance is genuinely exciting should OpenAI and Anthropic become public as reported. SpaceX could also ignite the IPO market while refreshing the quality and narrative of the US-listed technology universe. In our view – from a distance, given we have not seen their financials – all three are world-class, pure-play assets on critical investment themes. We are also keeping a close eye on Databricks and Stripe, both scaled mission-critical platforms.

Current Base Management Fee Arrangement:
effective 1 May 2022
| 0.80% | £0 - £2bn |
| 0.70% | £2bn - £3.5bn |
| 0.60% | over £3.5bn |
Base Management Fee Arrangement:
to 30 April 2022
| 1% | Up to £800m |
| 0.85% | £800m - £1.6bn |
| 0.80% | £1.6bn - £2.00bn |
| 0.70% | over £2.0bn |
Later, but still not a bubble
After a remarkable year, some of our 'bubble' indicators have moved up a notch. However, we still feel AI stocks are not in bubble territory and the current backdrop more closely resembles the mid- rather than late-1990s. Valuations look expensive relative to history but undemanding relative to the market – and far from 2000, when technology comprised 32% of market cap but only 12% of earnings, compared to 43% of the market cap (including communication services) and 38% of earnings today. The IPO market remains far from bubble conditions – just 31 venture-capital-backed technology companies went public last year (14 in 2024), versus 370 and 261 in 1999 and 2000 respectively. The average age at listing was 14 and 12 years for 2024 and 2025 deals, rather than five years for the 1,400 companies that went public between 1995 and 2000.
M&A (mergers and acquisitions) are another useful bubble indicator. Even ignoring software deals we consider defensive or private equity-related, 2025 was much busier for AI-related M&A – disclosed deal value of $120-125bn including software and security, c$50-55bn for pure hardware, infrastructure and talent acquisitions compared to $10-12bn in 2024. The 5-6x like-for-like increase looks more reminiscent of the mid-1990s when telecom and internet M&A increased 4-5x between 1995 and 1996. As a share of index market cap (up almost nine-fold since 1996), last year's activity looks even less significant and most of the largest deals were cash, not equity financed.
There has been a greater use of debt financing relative to earlier AI capex. According to the Financial Times, Oracle, Meta, xAI and CoreWeave have structured over $120bn of AI data centre financing through off-balance-sheet SPVs (special purpose vehicles), while UBS estimates $125bn flowed into AI-related project finance during 2025. We are not unduly concerned – most resemble sensible financing structures for long-life infrastructure assets, not dissimilar to aircraft leasing. The best borrowers continue to enjoy easy access to capital – Google's $32bn bond sale in February was 10x oversubscribed and completed within 24 hours. Nevertheless, the industry's need for external capital speaks to the scale and maturity of current capex plans. Pockets of exuberance are to be expected: in August 2025, OpenAI CEO Sam Altman called it "insane" that some tiny AI startups – "three people and an idea" – were being funded at billion-dollar valuations. While data points like this are unsettling, excitable private markets also reflect an acute shortage of AI talent.
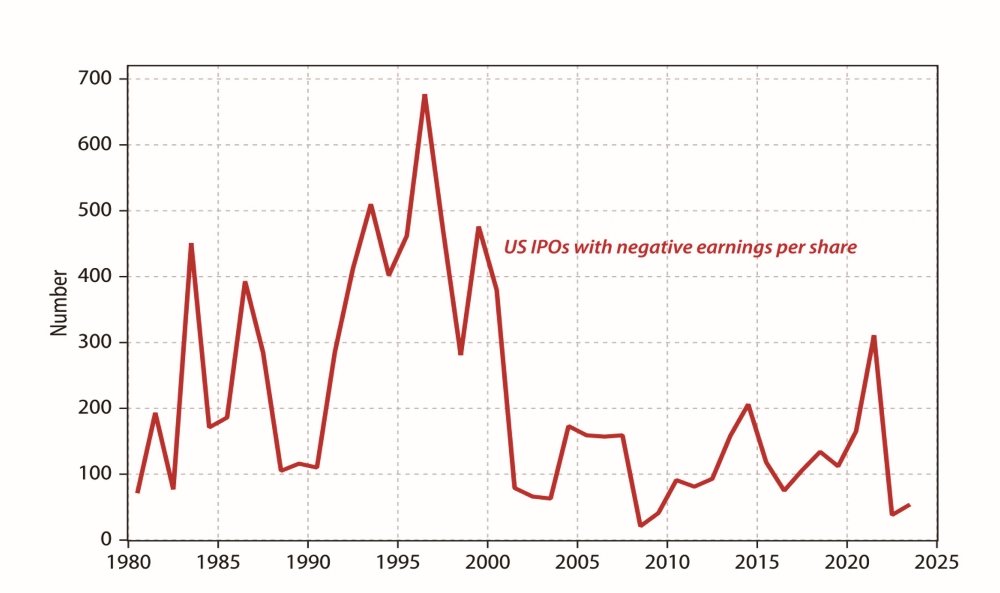
Source: Gavekal Research/Macrobond
Volatility likely
We still consider current conditions more analogous to the mid- rather than late-1990s and, as previously warned, the volatility that accompanied that period should be anticipated. The NASDAQ experienced seven corrections of more than 15% between 1995 and 1998, despite delivering substantial returns. Volatility should be considered an inherent feature of transformative technological transitions. This was certainly the case in 2025, a remarkable year punctuated by DeepSeek (which saw an AI leaders basket drop 18%) and Liberation Day tariffs (which triggered a 9% S&P 500 decline, pushed the VIX – a measure of volatility in the S&P 500 – to 60 (anything above 50 is cause for concern) and wiped roughly $5trn in market cap). Realised volatility ran at 19% – the 83rd historical percentile – and the largest peak-to-trough S&P 500 drawdown was 19%, nearly double the annual median of 10%. We expect heightened volatility to persist – elevated P/E ratios, tight corporate spreads, rising government debt, unprecedented AI capital spending, broadening AI disruption and record retail participation all leave markets with less margin for error should narratives shift.

Current Base Management Fee Arrangement:
effective 1 May 2022
| 0.80% | £0 - £2bn |
| 0.70% | £2bn - £3.5bn |
| 0.60% | over £3.5bn |
Base Management Fee Arrangement:
to 30 April 2022
| 1% | Up to £800m |
| 0.85% | £800m - £1.6bn |
| 0.80% | £1.6bn - £2.00bn |
| 0.70% | over £2.0bn |